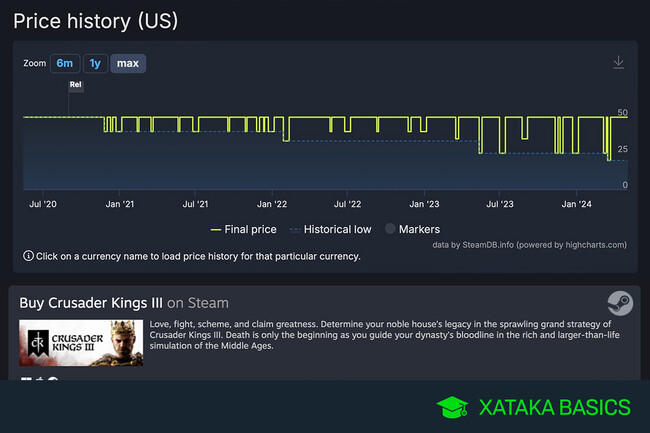
The price of Steam games has changed over time. Here, you’ll learn how to see how the prices have fluctuated since the release date.
We’ll explain how to check a Steam game’s price history. Whether you’re thinking of buying a game or want to see how good a discount on the platform really is, there’s a tool you can use to see how the price of a game has changed over time.
Steam itself doesn’t provide this information, so you’ll need to use SteamDB. This website displays a game’s price history in a graph format. You'll see the price at that particular time in history by clicking on a specific point in the graph’s green line. For your convenience, you can see the prices in all the different currencies available on Steam.
Knowing a game’s price history can help you make better decisions. For instance, if you see that a game’s price has “dropped” to $20 but was previously sold at $15, you’ll know that the current offer is not the best deal. Similarly, if you notice that a game was previously sold at $50 and is now available at a lower price, you can be sure that the discount is worth it, and you should use the opportunity.
View the Price Evolution of a Steam Game
First, go to SteamDB.info, a Steam game database with all sorts of information. Once you’re there, you’ll see a list of the most popular and played games. To check the price of a specific game, type the title in the search bar located in the upper left corner of the site. Alternatively, click on the game’s name in the lists that you’ll see on the main screen.
As you type the game title, a list of matching games and DLCs will appear. Simply click on the game you want to check the price of.
This will take you to the game’s page, where you’ll find a list of its price history. To check the price in your preferred currency, click on the Set your currency drop-down menu located at the top right of the list, and select the currency you want to use.
Once you’ve selected your preferred currency, scroll down to view a graph that shows the game’s price history. You can view the game’s price history since it first launched or specify a time frame (last 6 months or last year). This way, you can see how the game’s price has evolved over time.
On the graph, the highest price is at the top, which is usually the usual price, and below it are the occasional sales and the lowest prices. Additionally, you can find a timeline below to see when the game was priced at each price. All you need to do is click on any of the points on the graph to display the price on that particular date.
See all comments on https://www.xatakaon.com
SEE 0 Comment